EXCLUSIVE: Spokane Airports Usage Trends thru 2014
December 22, 2014
Update: Data tables have been added to the “read more” section. Additional charts from other sources have been added to confirm the trend shown in these charts.
Frontier Airlines is leaving the Spokane market, leaving 5 airlines (Southwest, Delta, United, American/USA, Alaska). There were nine airlines serving Spokane in 2010. The decline is due to airline mergers (Delta/Northwest, American/US Airways, and Alaska now buys all the capacity of Horizon) and airlines leaving the Spokane market.
Fewer airlines means less competition and likely higher prices for Inland Northwest travelers (especially when only 1 airline serves a destination city). Update Jan 2 2015: Confirmed. Spokane has the highest airline charges in the PNW.
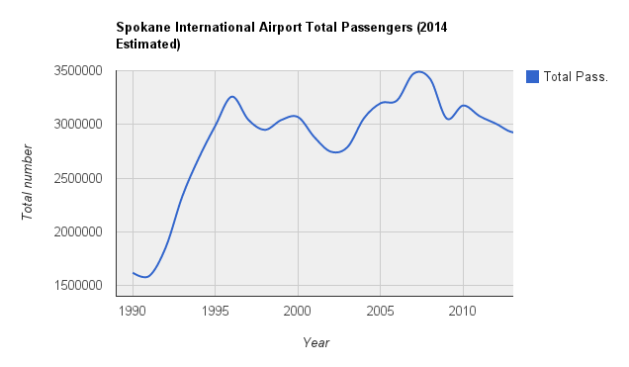
Spokane Airport Passenger Usage Trend
Total Aircraft Operations at Felts Field Airport
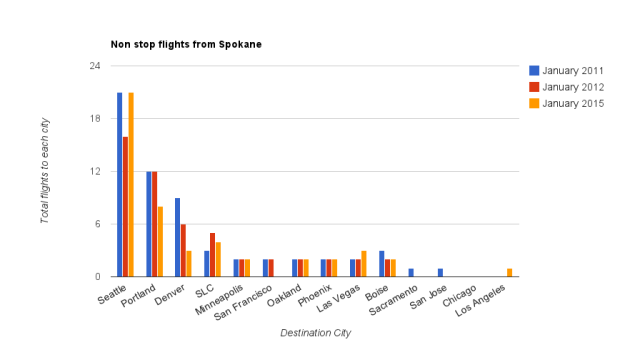
Non-Stop Destinations from Spokane and Number of Daily Flights
The orange column represents flight options for January 12, 2015. A different day might yield different results.
Notable Changes in Service
- Update March 2015: Alaska is introducing a twice per day turbo prop Q400 flight to Boise, starting in August 2015. This restores the Spokane-Boise route to 4 flights per day.
- 4 fewer flights to Portland than 2011.
- 6 fewer flights to Denver than 2011.
- 1 more flight to Salt Lake City than 2011; one less than 2012.
- Las Vegas is up by 1 and Boise is down by 1.
- Los Angeles now has 1 daily, taxpayer subsidized flight
- Chicago is served only in the summer.
- Service to Sacramento and San Jose discontinued.
- In 2014, Delta announced a summer time only, once per week on Saturday flight from Spokane to Atlanta. That flight does not currently appear on Delta’s summer 2015 schedule.
2/3ds of all Flights are to Two Airports: Seattle and Portland
All of the flights to Portland and about half of those to Seattle are on board turbo prop (propeller) planes (this ratio of turbo props to jets changes over time as airlines change their fleet usage).
Data Sources
Passenger data is from the FAA and the Bureau of Transportation Statistics. 2014 value is estimated from usage through October 2014. Some historical data is from the Spokane Airports web site, but Spokane Airports no longer appears to publish usage data. The passenger usage data starts in 1990 as that is the oldest data provided in the FAA and BTS online data sets.
Non-Stop destinations and flight counts are from looking at available flights departing Spokane for January 12th, 2015 using Expedia.com and Southwest.com (Southwest flights are not shown on Expedia).
This blog is an EXCLUSIVE report as local media have never publicized airport usage or non-stop destination trends. In fact, local media have previously reported on the “continued GROWTH” in aviation in Spokane even though aviation has been in a long term decline.
In 2001, 2005 and 2006, growth in passenger usage was a sign of economic success.
The terminal map lists “Delta, United, American” at Concourse B, but the Terminal B map shows “Delta, United, US Airways”. However, American and US Airways merged … and operate a US Airways flight from Spokane to Phoenix under the US Airways name.
Extra credit assignments
- Spot the bump in airport usage created by the expansions of the local Convention Center.
- Do you know what “code sharing” is? Some people don’t. Korean Airlines and Aeromexico DO NOT FLY TO SPOKANE.
- Anthony Gill writes “I wish the data weren’t recompiled. It’s hardly trustworthy as-is“. All of the above data is from SpokaneAirports.net, operated by Spokane Airports, the Federal Aviation Administration or the U.S. Bureau of Transportation Statistics. The Convention Center data is from the Community Indicators of Spokane web site, operated by the City of Spokane and Eastern Washington University, and from the Spokane Public Facilities District. For extra credit, please identify how these sources are untrustworthy.
- Is accurate data important for setting public policies or is it better to base policy on wishful thinking, exaggerations or lies? Do you think this data should be hidden from the public?
- Explain why the airport is named “Spokane International Airport” (click link for hints!) since there have not been international flights in decades.
Data Confirmation
Here is an official chart from Spokane Airports Master Plan showing historical traffic – for those that doubt the accuracy of the charts:
Chart from EWU Community Indicators of Spokane web site (red line at top added to show the curve) through 2013:
Charts from Eastern Washington University study 1992 to 2004:
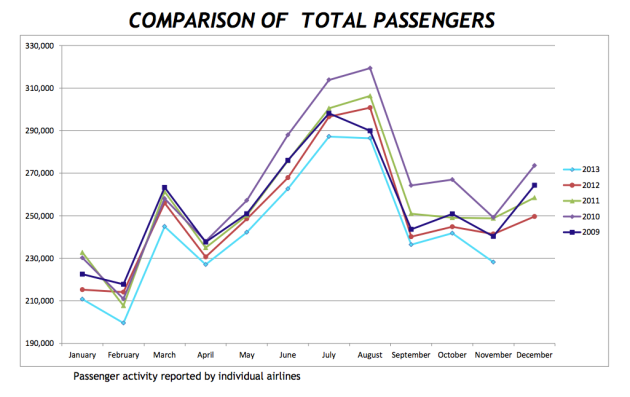
The following chart came from SpokaneAirports.net, the official web site of the Spokane Airports operation. Spokane Airports no longer appears to publish this information. As you can see, the airport’s own chart shows a decline over the past five years. For those on drugs, this chart shows monthly (not annual totals) and compares month versus month for each of the five years.
Still think the data is untrustworthy Anthony Gill?
Additional Reference
Still think the data is “hardly trustworthy as-is“? If you still think the data is “hardly trustworthy”, you might look into “cognitive dissonance” and the belief disconfirmation paradigm and how to deal with that.
Data Tables
All the data used in the charts follows.
GEG Passenger Data
| Total Pass. | |
| 1990 | 1619880 |
| 1991 | 1589123 |
| 1992 | 1855954 |
| 1993 | 2329953 |
| 1994 | 2687482 |
| 1995 | 2988575 |
| 1996 | 3258762 |
| 1997 | 3043238 |
| 1998 | 2949833 |
| 1999 | 3041626 |
| 2000 | 3068892 |
| 2001 | 2880186 |
| 2002 | 2745788 |
| 2003 | 2789505 |
| 2004 | 3059069 |
| 2005 | 3197440 |
| 2006 | 3224423 |
| 2007 | 3472901 |
| 2008 | 3423500 |
| 2009 | 3055081 |
| 2010 | 3176204 |
| 2011 | 3076554 |
| 2012 | 3005315 |
| 2013 | 2926858 |
| 2014 | 2956126 (est) |
Felts Field
| Felts Total | |
| 1990 | 68379 |
| 1991 | 83541 |
| 1992 | 84964 |
| 1993 | 69372 |
| 1994 | 69207 |
| 1995 | 69608 |
| 1996 | 65685 |
| 1997 | 62883 |
| 1998 | 72043 |
| 1999 | 74487 |
| 2000 | 76231 |
| 2001 | 69782 |
| 2002 | 66021 |
| 2003 | 70673 |
| 2004 | 65572 |
| 2005 | 68649 |
| 2006 | 65443 |
| 2007 | 72378 |
| 2008 | 66177 |
| 2009 | 65944 |
| 2010 | 63496 |
| 2011 | 59716 |
| 2012 | 52928 |
| 2013 | 54473 |
| 2014 | 53928 (est) |
Destination Trends
| Seattle | Portland | Denver | SLC | Minn. | SF | Oakland | Phoenix | Las Vegas | Boise | Sacra. | San Jose | Chicago | LA | |
| January 2011 | 21 | 12 | 9 | 3 | 2 | 2 | 2 | 2 | 2 | 3 | 1 | 1 | 0 | 0 |
| January 2012 | 16 | 12 | 6 | 5 | 2 | 2 | 2 | 2 | 2 | 2 | 0 | 0 | 0 | 0 |
| January 2015 | 21 | 8 | 3 | 4 | 2 | 0 | 2 | 2 | 3 | 2 | 0 | 0 | 0 | 1 |


You must be logged in to post a comment.