Spokane publicity you can’t buy at any price

In the past week, a body was found at Shields Park, another body was found near downtown Spokane.  Some one was shot in the Spokane Vally on Sunday morning – not even a peep in the news until Tuesday and still no names or descriptions or anything.  Another shooting took place on Wednesday (not clear  there were victims) and police shot and killed an unarmed mentally ill man on Thursday – the day after announcing a new gentler police department that has implemented new use of force guidelines to avoid killing innocent people like Otto Zehm, in the future.

Thursday, a 17 year old has been arrested for attempted murder after stabbing someone in the head in the morning.

Wednesday night an 88 year old World War II veteran was beaten outside the Eagles Ice  Arena, and died, resulting in Greater Spokane Inc’s greatest nightmare – a top of the page spread on DrudgeReport.com. You can’t buy publicity like this.

DrudgeReport

A top story on CNN and CNN.comcnn

It’s also a top story on CBSNEWS.com.

Friday morning, a man opened fire inside a pawn shop on E. Sprague Ave with claims of holding a hostage. On Sunday, in nearby CDA, police shot and killed a man. A few more assorted stabbings and assaults. Fun place! Oh, and yet another body found alongside a road early in the next week – and another self inflicted gun shot a day later.

Spokane has gone to hell and local political and business leaders have only themselves to blame. These are self inflicted wounds made as a result of self serving policy decisions.

Spokane is extremely sick. These acts of violence are not “normal”.

What we will do about it? Tell lies, lots of lies. That always works.

Start with the excuses – crime isn’t that bad

Monique Cotton with the Spokane Police Department also says the city investigates far less violent crime than property crime.”

except when it is

“Those type of weeks happen,” Sheriff Knezovich said. “It really is cyclical, the problem is, it’s becoming more and more the trend.”

So which is it? Crime isn’t that bad – or it’s becoming more and more the trend and we need more police officers?

WSU’s Spokane Real Estate Report

The WSU Washington Center for Real Estate Research issues a quarterly report on real estate in areas in Washington.

The following quotes on general economic conditions are from the summary for the Spokane Kootenai area for the Spring 2013 report. Conditions may have changed since the Spring report. Their general thoughts on the Spokane economy are glum, at best, unfortunately.

  • Possibly seeing a net out migration of residents
  • Total employed is less than in 2006 – we should have 15,000 to 20,000 more jobs today.
  • Per capita income is about where it was in 2007.
  • Taxable retail sales trending around 2006 levels.

Link: The Real Estate Report – Spokane Kootenai Real Estate Research Committee. Quotes from the report:

DRIVER LICENSE SURRENDERS
The data makes a case for little change in migration to the county. There is certainly no increase of in-migration. Other data would indicate that out-migration has picked up. This sensitive indicator bears watching.
LABOR FORCE
The labor force is the same size as 2007. Total employment is 4 thousand less than the 2006 annual average. While there are kernels of positive results in the employment picture, the reality is that there should be 15 to 20 thousand more people working in this market.
PER CAPITA INCOME
Through 2011, real per capita personal income was less than the 2007 total. Projections for 2012 and 2013 would indicate some improvement. Projections by Global Insight indicate that total Personal Income is now over $18 billion and may approach $20 billion by 2015. Transfer payments from the Federal Government are still a big factor for the County (23%).
TAXABLE SALES DATA
Nice turnaround in 2012 but still below 2006 total. Contracting sales are running at 75% of peak. The County needs at least $280 million in new construction activity.

Spokane County Rate of Growth in Jobs is Slowing

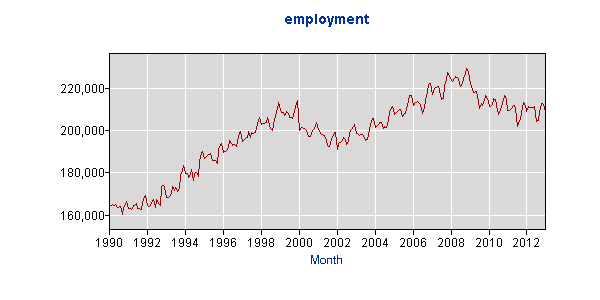
This chart shows non-farm jobs in Spokane County from 1971 to 2013. The chart is created by the BLS web site. Here is the original chart of non-farm jobs from 1990 to the present:

SMS53440600000000001_418171_1376952772411

The chart breaks into sections, roughly as “before 1995”, “1995 to 2001”, and “2001 to 2013”. A line is drawn through each section to graphically illustrate the rate  of job growth.

SpokaneCountyJobGrowthRateSlowing

The lines might also have been drawn from 2001 to 2007 and then 2007 to 2013, however that would result in a steep downward trend in the last section.

The rate of growth in new jobs being added to the  Spokane County economy has slowed markedly since the turn of the century.

The largest component of this slow down is the no-job-growth economy of the City of  Spokane where total jobs is about the same as in the mid-1990s.  Here’s the chart that shows the stagnant job market in the City:

Employment in City of Spokane Stagnant Since mid-1990s

Spokane

Chart is from the US BLS web site.

The lack of job growth should be a high priority focus of local political and business leaders (Possibly related news item and comment). Sadly, there appears to be little to no serious priority given to this crisis.

(Can you spot the jobs increase from the last two Convention Center expansions?)

Spokane Unemployment for July at 8.1%

Total employed – note that past numbers have been adjusted since previous releases.
2013JulEmp
Charts and data tables are from the Washington Employment Security Department.

For the month of July (and July only) 54% of jobs lost during the downturn have been recovered.

Long Term Spokane County non-farm Employment History (Chart from US BLS to early 2013)
2013JanBLSTotalEmployed

Unemployment

2013JulUnemp

Essentially all the job losses were due to seasonal layoffs of annually contracted education sector workers. A school worker told me she is eligible for unemployment during the summer and then is rehired in the fall.

2013JulGov

All of the “government” (education) jobs will come back September-October as shown by this history chart. The annual large cycle in employment is due to the government sector.

2013GovEmp

Spokane Airports Usage Update

Local leaders insist Spokane is seeing continued growth in aviation but back in the reality-based world this is what actual data looks like through June (first half of 2013 extrapolated to full year for the chart):

SIA Jun 2013

Was hoping to see growth show up in June as this now includes the Allegiance once per week Hawaii flights (to be discontinued shortly) and the daily subsidized flight to Los Angeles that started in June. Perhaps growth may resume in the summer.

Felts Field may have bottomed. We hope. (The chart title has a typo  – that should say “thru Jun 2013” not Jan 2013).

Felts Jun 2013

Local air traffic has long been used as a local economic indicator. During periods of growth, local officials routinely said air traffic growth was an indicator of the strength of the local economy. A decline in local air traffic (including passenger usage) indicates the Spokane County economy remains weak.

Washington State July unemployment rate increases slightly

The statewide unemployment rate increased slightly to 6.9%.

So far, Washington has recovered about eighty-three percent of the jobs lost during the recession.

via July unemployment rate inclines slightly, while jobs continue to climb.

While the State recovered 83% of jobs lost, Spokane County has recovered just 36% of jobs lost.

Data from WA ESD June employment table:

  • Lowest June employment during downturn was 206,100, highest June reading reached previously was 221,400.
  • A total of 15,300 jobs were lost between the highest June and the lowest June employment levels.
  • As of June 2013, there are 211,600 jobs for a gain of 5,500 since the lowest point. This represents a recovery of 36% (5,500 / 15,300) of the jobs lost.

Spokane County job growth is just under half that of Washington state.  No explanation has been offered as to why that is happening.

Spokane Home Price Index – relative home prices over time

“The House Price Index (HPI) shows changes in Spokane, WA single family home prices in logarithmic scale. The March, 1995 index value equals 100.  Updated Tuesday, July 2, 2013. Real estate forecasts, analysis, statistics and appreciation rates are provided below.”

Spokane Real Estate Market – Home Price Forecast | LittleBigHomes. (The web site does not define the source of home prices – we assume this is average home price whereas realtors and local news often use median home prices.)

Here are historical year over year appreciation rates for Spokane, from the above web site:

1983      4.83%
1984      19.24%
1985      -2.69%
1986      2.69%
1987      -2.76%
1988      2.44%
1989      6.85%
1990      12.55%
1991      9.13%
1992      10.89%
1993      9.06%
1994      3.75%
1995      5.72%
1996      -0.08%
1997      1.77%
1998      2.22%
1999      -0.57%
2000      1.81%
2001      4.54%
2002      3.40%
2003      3.90%
2004      11.09%
2005      19.17%
2006      13.15%
2007      5.87%
2008      -2.64%
2009      -6.61%
2010      -3.40%
2011      -5.58%
2012      -1.50%

2013 July Year over Year is -2.4% while 2013 cumulative versus 2012 is +1.7%.

Local news report uses an odd headline: “Spokane home sales have ‘recovered dramatically’ – Spokesman.com – Aug. 9, 2013″ based on unit sales up while pricing is down Year over Year for the month and barely up for the full YoY comparison.

Here is a comparison of Spokane versus Seattle, side by side, Spokane on the left, Seattle on the right.  These indices are a logarithmic scale, both adjusted to a 100-level index, and should be used only to compare relative price growth, not actual prices. Horizontal tick marks are five year periods. A steeper curve means higher or faster price appreciation. Original charts slightly different in vertical height and re-scaled to be equal in size.

Spokane                                                                                        Seattle

seattle-wa-december-1

What this shows is that Spokane home prices appreciate much slower than in Seattle (and we could find similar comparisons to other major cities).

This means moving to Spokane (or any slow growth economic area) can become an unexpected one-way ticket.

If someone sells a home in a metro area, moves to and buys a home in Spokane  (or any slow growing area), they will find that if they move back to the metro area, home prices at their destination will have risen much faster than those in Spokane.  Because of this, a move to Spokane can become an unintended one-way ticket as Spokane sellers’ equity gains do not keep up with the destination market home price appreciation.

If that does not make sense, consider an example.

Read more of this post

Spokane Suicide Rate

Learning that someone I knew had committed suicide gave me pause – since living in Spokane I have known 6 people who committed suicide, plus one attempted suicide.

Curious, I looked up some data. The youth suicide rate in Spokane is 4 to 6 times greater than in the State.

Youth Suicide Rate 2005-2009

SpoSuicides2005-2009Youth

Read more of this post