‘Warrior mindset’ police training proliferated. Then, high-profile deaths put it under scrutiny.

Not good:

According to data obtained by The Post, police for the city of Spokane – a separate entity from the county sheriff’s office – shot 27 people from 2013 to 2019. For that period, Mapping Police Violence ranked Spokane as the city with the third-highest rate of police killings in the nation.

Source: ‘Warrior mindset’ police training proliferated. Then, high-profile deaths put it under scrutiny.

Spokane Airport and PFD Chart Updates

I was asked to update some charts (this blog is not coming back to life but I may update some additional charts too).

Spokane International Airport and Felts Field Usage Trends

image-11

Passenger usage has been a flat line for 30 years. When passenger counts went up from 2003 to 2007, the Airport and local officials said passenger counts were a proxy for the local economy. A larger post on airport trends through 2014, including links to data sources, is here.

The next chart measures take offs and landings at Felts Field.

image-10

Data: US Bureau of Transportation Statistics, FAA

Spokane PFD Facilities Trend

image-9Data: Spokane PFD and Community Indicators of Spokane.

Since the economic depression in Spokane, the PFD’s attendance has rebounded but remains below the 2010, 2007 and 2001 peaks. A regression line drawn from 2001 to the present is a slight downwards trend.

Through 2015 end of year:

image-6

Reminder: The PFD conducted local economic impact studies for 2007 and 2010 and claimed these two years were representative of every year. 2007 and 2010 are represented by the two large spikes in the orange curve above; history shows they were not representative of the PFD’s normal impact on the Spokane economy.

How Many Events at the Spokane Arena Required the 2012 Seat Expansion?

In 2012, the Spokane PFD went to voters with a campaign to expand the Spokane Arena, saying the NCAA would require 12,000 “sellable” seats to hold future NCAA events at the Arena. The then 12,000 seat arena did not have enough seats to have 12,000 “sellable” seats (many seats are used by media, bands, cheer teams and others and were not “sellable”). The expansion led to a total of 12,638 potential seats in it largest seating configuration.

After the election was held, the NCAA reset the seating requirement  down to 10,000 “sellable” seats. The PFD kept this quiet and local media hid this change for months. See NCAA reduces seating requirements; Spokane PFD’s Arena expansion no longer required.

But at least the Arena would have more seats to fill at other events, they said.

How many events in 2015 filled the new seating capacity?

Zero.

Source: 2015 Year End Report, page 52 (published by the Spokane PFD).

2015pfd-topevents

In 2014, a state high school basketball tournament exceeded 13,000 attendance, but this is not individual game attendance for two reasons:

  1. The maximum seating capacity for the Arena, when configured for basketball, is 12,210. The maximum seating for any configuration is 12,638.
  2. They combined attendance of multiple games played on the same day at the Arena (which is how the PFD typically presents attendance figures). Old event schedules indicate there were 3 to 8 games played each day of the tournaments. Thus, the Arena did not reach the new full capacity.

Related old posts:

EXCLUSIVE: No correlation between Convention Center and Airport usage

The Convention Center is said to be an economic driver that brings in outside visitors to Spokane, and this is the justification for continually expanding the facilities.  In just a few years, the PFD will seek additional taxes to expand again.

Does this economic driver work? Here is a comparison of airport usage versus convention center usage. Visually, there is no correlation; statistically, the R-squared value of the correlation is 1.6% (meaning zilch correlation).

AirVsConvention

If the Convention Center brings in outside visitors, they do not arrive by air or the number is so insignificant as to have no impact.

The air passenger data was scaled to a similar range to the Convention Center attendance for the purpose of comparison. In the chart above, the Y-axis shows convention center attendance; multiply by 10 for the air passenger number.

There is no correlation with jobs, either.

The top 2 largest events account for more than 25% of all usage:

  • Bloomsday, 47,346 people
  • PNQ Volleyball, 44,461 people

Outside of those two events, the remaining events average less than 700 people per day, the rest of the year. 

The Convention Center was just expanded so it can accommodate large events. Unfortunately, for a facility designed to accommodate up to 6,500 people, actual utilization is closer to 10% of best case, most of the year.

Spokane Convention Center Usage By Month

SpokaneCCByMonth

Spokane Arena By Month

For many months, the facility is almost unused.

SpokaneArenaByMonth

Spokane INB Performing Arts Center

The INB Performing Arts Center is barely used for several months of the year.

SpokaneINBByMonthAll charts come from the SpokanePFD.org web site and the 2014 end of year annual report produced by the Spokane PFD.

Keep this in mind when in 2 or 3 more years, the Spokane PFD comes asking for more money for yet another expansion of their empty facilities.

Hoopfest Ironman

EXCLUSIVE: Spokane Public Facilities District (PFD) Attendance thru 2014

The following charts show the attendance trend through the end of 2014 for Spokane PFD facilities.

The upward growth at the right of the combined “all facilities” attendance is due almost entirely to a sharp upwards trend at the Convention Center in 2014. Combined facilities attendance trend still remains slightly down over the 15 year period since 2000.

AllFacilities

image (1)

image (2)

The Convention Center experienced its first significant increase in attendance in a decade. Two events accounted for nearly 30% of all usage during the entire year. (Most of the year, the facility is used sparsely with small meetings of 100 or so people each day.)

image

This increase occurred prior to the completion of the third expansion of the Convention Center facilities, which opened in early 2015.  After more than a dozen years of flat to downward usage, and three taxpayer funded expansion projects, the CC has broken through its past “no growth” ceiling.

The above charts have never appeared in any Spokane media outlets – the attendance figures are intended to be top secret, apparently. All data comes from the Spokane PFD.

#Spokane City Council versus #RachelDolezal

City council president Ben Stuckart says the candidates were interviewed by city council members or the mayor, and then reviewed once again.

via Process of vetting candidates for citizen police ombudsman commi – Spokane, North Idaho News & Weather KHQ.com.

They admit they looked at a credit report, although its not clear they cared about what they would have found. Or that they cared.

Rachel Dolezal: 1, City Council: 0

dolezal ewu


Rachel Dolezal: 1  Mary Cullinan, President, Eastern Washington University: 0

10930913_1567474800166208_412794627382742337_o


Rachel Dolezal: 1,  Spokane Mayor David Condon: 0

CHfR5jBW8AAj-fi

Rachel Dolezal: 1, Marilyn Mosby, Baltimore City, State’s Prosecutor: 0


Spokane City Council fires #RachelDolezal from OPOC

Rachel Dolezal fired by unanimous vote of Spokane City Council. More here.

Predictable outcome.

Spokane’s non-existent economic development agencies

Wonderful essay from the SpokanePlanner about Spokane’s delegation of “public economic development activities to private, non-profit organizations is dysfunctional (at best)” and laced with secrecy and good ol’boy backscratching:

For Spokane’s Holy Trinity to succeed, success is defined as how much they panhandle from Spokane’s business and governmental community, and not necessarily defined by truly cause and effect economic development.

Fundraising, grant writing, and generally asking other people for money is not an economic development strategy; to the contrary, it’s what you do when you don’t have an economic development strategy.

SpokanePlanner believes the PFD is one of the most effective economic development agencies in Spokane. However, as shown on this blog, the PFD’s track record based on the objective metric of attendance and usage, is awful:

chart_1

chart_2

chart_3

chart_4

If that sort of poor performance gets ranked as a top economic development agency, then Spokane is doomed to a dim future.

Incredibly, the State Auditor found the PFD, in a fit of little league corruption, handed out big bonuses to staff in 2004 based on creative accounting. Look at the attendance charts, above, for 2004 – that deserved bonus payments to staff?


STA Proposition 1 promoters say tax will benefit Puget Sound transit!

We cannot make this stuff up – right there on their web site yesforbuses.org it says:

  • A “Yes” vote on Proposition 1 will reduce “the operating costs of Sound Transit Authority“.
  • “A “Yes” vote for increased funding for Sound Transit Authority means more than 1,000 new jobs for Spokane County.”

Here is a screen capture of their web page – click for full size view.

YesForBuses

Guess they copied old campaign literature from Sound Transit, an organization that was officially known as Regional Transit Authority but began using the name “Sound Transit” in 1997 (not Sound Transit Authority).

STA plans to purchase the Tesla of buses: Have we forgotten the STA’s hybrid bus boondoggle (or this)? Apparently.

There’s nothing wrong with seeking expansions and improvements in public transit. But with this history of goof ups and waste, should STA be trusted?


EXCLUSIVE: Spokane Airports Usage Trends thru 2014

Update: Data tables have been added to the “read more” section. Additional charts from other sources have been added to confirm the trend shown in these charts.

Frontier Airlines is leaving the Spokane market, leaving 5 airlines (Southwest, Delta, United, American/USA, Alaska). There were nine airlines serving Spokane in 2010. The decline is due to airline mergers (Delta/Northwest, American/US Airways, and Alaska now buys all the capacity of Horizon) and airlines leaving the Spokane market.

Fewer airlines means less competition and likely higher prices for Inland Northwest travelers (especially when only 1 airline serves a destination city). Update Jan 2 2015: Confirmed. Spokane has the highest airline charges in the PNW.

Spokane Airport Passenger Usage Trend

chart_1 (1)

Total Aircraft Operations at Felts Field Airport

chart_2 (2)

Non-Stop Destinations from Spokane and Number of Daily Flights

The orange column represents flight options for January 12, 2015. A different day might yield different results.

chart_1 (2)

Notable Changes in Service

  • Update March 2015: Alaska is introducing a twice per day turbo prop Q400 flight to Boise, starting in August 2015. This restores the Spokane-Boise route to 4 flights per day.
  • 4 fewer flights to Portland than 2011.
  • 6 fewer flights to Denver than 2011.
  • 1 more flight to Salt Lake City than 2011; one less than 2012.
  • Las Vegas is up by 1 and Boise is down by 1.
  • Los Angeles now has 1 daily, taxpayer subsidized flight
  • Chicago is served only in the summer.
  • Service to Sacramento and San Jose discontinued.
  • In 2014, Delta announced a summer time only, once per week on Saturday flight from Spokane to Atlanta. That flight does not currently appear on Delta’s summer 2015 schedule.

2/3ds of all Flights are to Two Airports: Seattle and Portland

chart_2 (1)


All of the flights to Portland and about half of those to Seattle are on board turbo prop (propeller) planes (this ratio of turbo props to jets changes over time as airlines change their fleet usage).

Data Sources

Passenger data is from the FAA and the Bureau of Transportation Statistics. 2014 value is estimated from usage through October 2014. Some historical data is from the Spokane Airports web site, but Spokane Airports no longer appears to publish usage data. The passenger usage data starts in 1990 as that is the oldest data provided in the FAA and BTS online data sets.

Non-Stop destinations and flight counts are from looking at available flights departing Spokane for January 12th, 2015 using Expedia.com and Southwest.com (Southwest flights are not shown on Expedia).

This blog is an EXCLUSIVE report as local media have never publicized airport usage or non-stop destination trends. In fact, local media have previously reported on the “continued GROWTH” in aviation in Spokane even though aviation has been in a long term decline.

In 2001, 2005 and 2006, growth in passenger usage was a sign of economic success.

The terminal map lists “Delta, United, American” at Concourse B, but the Terminal B map shows “Delta, United, US Airways”.  However, American and US Airways merged … and operate a US Airways flight from Spokane to Phoenix under the US Airways name.

Extra credit assignments

  • Spot the bump in airport usage created by the expansions of the local Convention Center.
  • Do you know what “code sharing” is? Some people don’t. Korean Airlines and Aeromexico DO NOT FLY TO SPOKANE.
  • Anthony Gill writes “I wish the data weren’t recompiled. It’s hardly trustworthy as-is“. All of the above data is from SpokaneAirports.net, operated by Spokane Airports, the Federal Aviation Administration or the U.S. Bureau of Transportation Statistics. The Convention Center data is from the Community Indicators of Spokane web site, operated by the City of Spokane and Eastern Washington University, and from the Spokane Public Facilities District. For extra credit, please identify how these sources are untrustworthy.
  • Is accurate data important for setting public policies or is it better to base policy on wishful thinking, exaggerations or lies? Do you think this data should be hidden from the public?
  • Explain why the airport is named “Spokane International Airport” (click link for hints!) since there have not been international flights in decades.

Data Confirmation

Here is an official chart from Spokane Airports Master Plan showing historical traffic – for those that doubt the accuracy of the charts:

SIA1

Chart from EWU Community Indicators of Spokane web site (red line at top added to show the curve) through 2013:

EWIAirports2

Charts from Eastern Washington University study 1992 to 2004:


SIA1992-2004

The following chart came from SpokaneAirports.net, the official web site of the Spokane Airports operation. Spokane Airports no longer appears to publish this information.  As you can see, the airport’s own chart shows a decline over the past five years. For those on drugs, this chart shows monthly (not annual totals) and compares month versus month for each of the five years.

5yrComparison


Still think the data is untrustworthy Anthony Gill? 

Additional Reference

Still think the data is “hardly trustworthy as-is“? If you still think the data is “hardly trustworthy”, you might look into “cognitive dissonance” and the belief disconfirmation paradigm and how to deal with that.

Data Tables

All the data used in the charts follows.

Read more of this post

EXCLUSIVE: Spokane Public Facilities District (PFD) Attendance Trend through 2013

The Spokane Public Facilities District (PFD) operates the Spokane Veterans Memorial Arena, the Spokane Convention Center and the Spokane INB Performing Arts Center.

Attendance (usage) trend through end of 2013 for all PFD facilities, combined:

chart_4

Based on the following trend line,  the INB will close in 2025 when it is no longer in use:

chart_3

Convention Center attendance less than 2001

The third expansion project is nearly done – considering attendance is less than 2001, a year-over-year increase should not be difficult to achieve in 2014 or 2015.

chart_1

Spokane Arena Saw a 10% increase Y-o-Y

Without the Arena, the PFD’s total attendance would have sunk further in 2013. The two spikes are the years that the U.S. Figure Skating Championships were held in Spokane. The PFD produced and released economic studies based on exactly those two years and forecast future economic benefits to Spokane would be identical to those atypical years.

Even with gains in 2013, attendance in 2013 remains less than in 1999.

chart_2

The Spokane Chiefs and the Spokane Shock accounted for more than half of total Arena attendance in 2012. The new 2014 WSU-GU basketball game may help the Arena see better usage.

The above attendance trend charts have never appeared in Spokane media. The attendance charts do not appear on the PFD’s web sites. (Similarly, Spokane Airports has a nice redesign of their web site – but it appears they have removed their passenger usage information. The data is available, with a bit of work, from the FAA and BTS.)

The long term trends illustrate a root cause problem for all of Spokane – the lack of accountability and the failure to hold management (not just a problem at the PFD but at other organizations’ too) accountable for obvious measures of project success or failure.

With the abysmal performance and track record shown in the charts, why do we still have a CEO for life of the PFD? Or CEOs for life at other local organizations that fail to meet milestones and objectives?

Update: That question can now be answered: Because the Spokesman-Review’s owners own a big section of downtown Spokane and the newspaper has launched an all out propaganda war, running repeated stories about how wonderful the Convention Center expansion is for Spokane. The paper has made a mockery of itself with over the top propaganda to benefit the PFD and the downtown business cartel.

References

All data came from EWU Community Indicators of Spokane and Spokane PFD web site documents. 

Data sources and Alternate Data Confirmation follows.

Read more of this post

“The X Report”

A review of some “big picture” economic indicators for the Spokane area.

Spokane Airport passenger usage remains weak – now less than in 1995.

chart_1 (1)

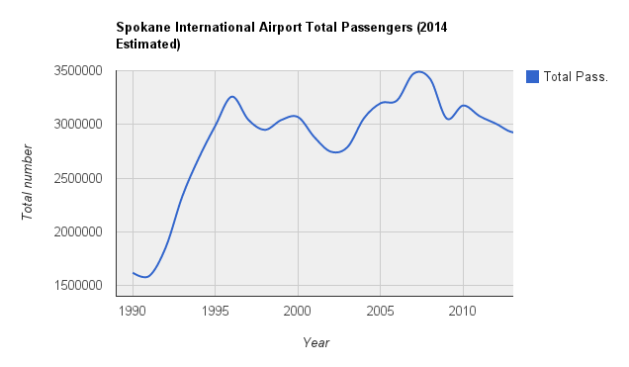
We call this “growth”, of course. (See the Comments to this post to see how a rise in passenger use was called a positive economic indicator by local promoters in 2001, 2005 and 2006 but when passenger levels declined they now pretend passenger usage no longer matters. Right.)

Felts Field air operations fell off a cliff:

chart_2 (2)

Total air operations in the area have collapsed (but local political leaders refer to this as “continued growth of aviation!” – may be if we turn the chart upside down!)

CombinedSIAFeltsAllOps-3Non-stop year-round destination cities have declined from 18 to 11 (including the subsidized daily flight to Los Angeles).

The rate of growth in jobs (for the entire County) has slowed. The area is no longer producing jobs at the same rate as natural population growth (from births and inbound migration, over time). That means the population is getting larger but the number of jobs is not keeping up. Here’s a chart highlighting the slow down in job growth:

SpokaneCountyJobGrowthRateSlowing

Spokane County non-farm jobs trend – mostly flat since 1998.

2013JanBLSTotalEmployed

City of Spokane jobs have been going down for about two decades – there is no increase in net jobs since the mid 1990s.

Can you spot the increase in jobs created by the Convention Center expansions? The total number of jobs in the City of Spokane has continued to fall, even after passing their expansion initiatives. (Chart from US BLS, updated to early 2014.) The City of Spokane has flat lined. 

LAUCT536700000000005_742370_1398301192417

Unfortunately, Spokane was ranked as the worst metro area out of 100 for job growth in a 2012 poll.

While the United States has recovered nearly all jobs lost since the 2008 downturn, and Washington State has recovered more than all the jobs lost since the downturn, Spokane County has recovered about half the jobs lost. Here are the charts for the U.S. as a whole, the State of Washington, and then Spokane County.

(At the end of 2014, there are some indications that the US economy may be headed into a slowdown. If this happens, the effects on Spokane would be bad, very bad, as Spokane has not yet fully recovered from the 2008 downturn.) (deleted as the economic situation seems to have stabilized since that was written)

Specifically:

  • US jobs regained – about 100%
  • WA jobs regained – more than 100%
  • Spokane County jobs regained: 52% using seasonally adjusted totals, or 44% using non seasonally adjusted data

United States

(From US BLS)

CES0000000001_729328_1398279732234

Washington State

SMS53000000000000001_729393_1398279809663

Spokane County

SMS53440600000000001_729435_1398279884691

Median Family Income Compared to Other Washington Cities

Spokane’s economic situation is not good: Spokane ranks 53d out of 59 Washington cities for median family income

Spokane’s Housing Stock is Old – Highlighting the Limited Economic Growth in the Area

Growing cities, with growing economies, show newer housing – Spokane has a stock of old housing, indicating low growth. The boom years are obvious in this chart – 20% of homes here were built in 1900-1919 (mining boom), and 31% in 1940-1959  (aluminum processing boom, post World War II growth of families):

app

Here is a typical growing city housing age pattern (in this example, Olympia, WA) – in a modern, growing city, you can see that more homes are built to meet the demand of contemporary growth.

app

Spokane has essentially no growth and hence, very little new home construction compared to thriving cities. More example cities are here.

Home Sales

Chart of the number of home sales from 2000 to 2014 (only through spring as this chart is slightly out of date):

image The original chart for the above (from Trulia.com) used a logarithmic scale for the Y-Axis which makes the peaks and valleys nearly flat.  A software tool was used to convert the log scale chart into a linearly scaled Y-Axis to show the trend in a format that most readers understand.

The next chart shows that median sales prices are basically flat since 2006.

Spokane-Median

Income and spending lag:

This chart shows how taxable spending per household has trended downwards in the past decade. The data for this chart is based on retail sales taxes collected through 2011. Since then (not shown in chart), retails sales have begun to grow again.

The blue line shows real median household income while the red line is an indicator of spending per household.

SpokaneMedianHouseholdIncome

Per Capita Income Trend Is Downwards

This chart has not been updated since 2008 but per WSU’s CORE research report, current per capita income is at 2007 levels. Per capita income is continuing to sink over the long term, relative to elsewhere. The lines in this chart indicate Spokane per capita income as a percent of the average per capita income in the state of Washington (red) and the U.S. as a whole (blue). Over time, the per capita income in Spokane, relative to everywhere else, goes down. Note that GSI will be happy to show you a chart of rising per capita income in the area – their chart is true too. But the problem is that Spokane incomes rise much slower than elsewhere such that over time, Spokane residents fall further and further behind the rest of the state and the country.

The Spokane County GDP per capita is unchanged from 2001 through 2011 (see bottom line in chart) – in other worlds, flat lined, like Convention Center attendance (well, not quite the same – the PFD’s facility usage actually went down over this period):

GDPPerCapita

A chart of pay in Spokane County versus King County

Attracting high skilled talent for high paying job categories is tough due to the large difference in pay between Spokane and the other big city in Washington:

SpokaneVsKing

The next chart has not been updated but the trend remains the same today. Incomes in the rest of the state climb twice as fast as those in Spokane.  The blue line represents the rate of increase in Washington State; the red line is the rate of increase in Spokane County. Over 30 years, Spokane pay is falling further and further behind the rest of the state.

SpokaneBirthsByMedicaid

Transfer payments are now about 23% of area personal income.

Transfer payments are primarily Federal payments made without a contemporary service or product delivered in return. Examples include disability payments, unemployment compensation, Medicare/Medicaid payments, government pensions and other government benefit programs. In other words, almost $1 out of every $4 here is government payouts, not earnings from contemporary work. The problem is not that there are transfer payments – the problem is that the steady growth in transfer payments is not sustainable.

Spokane’s Heavily Subsidized Economy

The primary purpose of the Spokane Public Facilities District, like nearly all municipal convention centers, is to provide a tax subsidy to the local hotel and restaurant industry. This use of publicly funded convention centers as a hidden subsidy of local hotels is widely documented in the convention center industry literature. In Spokane, it is codified – one member of the five member Board of the Spokane PFD is required to be someone working in the hotel industry. There is no requirement that, say, the PFD Board include a member of the general public to represent the interests of Spokane residents and taxpayers (the peons do not rank in this community).

The long vacant Ridpath Hotel may get re-opened and turned into downtown condos some day. But only with substantial tax subsides. About 1/4th of the cost is proposed to be funded by tax credits issued after declaring the not very old hotel as a historic building.  The city is also proposing to give Federal Housing and Urban Development grants to the developer. More taxpayer subsidies for downtown.

The proposed Spokane Field House in downtown is an extension of the PFD’s subsidy program to local hotels. Taxpayers will fund a downtown sports complex with the goal of bringing in some outside visitors to fill downtown hotels and restaurants. This is an indirect subsidy to Walt Worthy’s “convention center” hotel across the street.

Indeed, the PFD’s own economic study shows who actually benefits – and its hotels and restaurants:

WhoBenefits

The sad thing about all these subsidies to the hotel industry is that they do not actually work.

Here is a chart of hospitality industry jobs in Spokane County.  After THREE expansions of the Convention Center, we have fewer jobs in the hotel industry than we did in 1999 when we first began expanding the Convention Center!

Hospitality industry employment chart from the US BLS from 1993 to 2014:

SMU53440607000000001_730618_1398282555622

The downtown meme of ever expanding public facilities and more subsidies turns out not to have met the original claims for increasing jobs. Today we have fewer hotel jobs and fewer overall jobs in the City of Spokane than before the expansion. Expanding the Convention Center has resulted in FEWER JOBS.

Nothing happens in Spokane unless the local oligarchs are subsidized by the taxpayers. This is a form of transfer payments from poor people to developers.

Now we hang our hat on future medical school with an exaggerated economic benefit calculation  (local promoters nationwide engage in absurd and inflated exaggerations of all economic studies – most of these studies are not worth the digital ink they’ve spilled – same for Spokane). And of course, salvation will come with a heated pedestrian bike bridge!

Spokane needs real industry, designing and building products. From insect traps to pharmaceutical manufacturing to perhaps restoration of the lost high tech manufacturing sector, these are the sectors that generate real growth and jobs. But we just keep subsidizing downtown businesses that fail to deliver on their promises. Always have, and always will. Consequently, Spokane is going no where – the trends all remain negative (see charts above).

The Primary Economic Cluster in Spokane is Land Development

The primary economic cluster of Spokane is manipulating government so land speculators can profit. Here is a quote from Bob Herold of the Inlander:

“Well, I’ve learned that in Spokane, economic development most often begins and ends with making a profit off land speculation. It’s a cultural thing, and government’s job here is to help make the speculation pay off.”

And this business model works well for those who have influence. The largest media operator is one of the largest landowners in the region and has a long history of using their media influence to push government programs that benefit the owners (see The Fancher Report, the non-fiction novel Breaking Blue, or this blog for examples).

Contemporary examples include:  repeated Convention Center expansions (and their inability to meet any objectives) the “grand iconic unique in the world (except its notheated pedestrian/bike bridge, a proposed downtown “trolley” to benefit downtown, the “growing University District” (whose numbers show no growth) and the past and future for a light rail line that passes by the oligarchs’ properties runs from the underused airport to downtown and then to Liberty Lake (remember the two votes on that last decade?)

Update: Another economic cluster is government funded torture research hidden away in our small town. It’s a big industry in Spokane. Really big.

Crime

We cannot draw an accurate long term crime trend chart because of changes made in the reporting system last decade that resulted in a drop in crime reports. We’ll leave this topic with this chart – in 2011 and 2010, the auto theft rate in Spokane was the 4th highest in the nation but dropped in 2012 to 9th place:

image004

Accountability

A related crime problem is the culture and general corruption of the police in Spokane.  A week hardly goes by without yet another police scandal – from having sex on duty to running steroids and drugs to shooting people in the back of the head to killing Otto Zehm. This is likely a symptom of the difficulty in attracting high quality, high performing individuals to Spokane. And that is not just a police problem but one that impacts a wide swath of organizations both public and private.

We end up with local organizations having the same leadership for a quarter century, a sure sign of stagnation. From head dog catcher to GSI to the PFD to the STA -while some organizations are effective, some are not – yet their leadership is held on forever. There is no accountability for the PFD’s failure (by the core metrics of attendees and local jobs) or GSI’s long term ineffectiveness (as seen in the overall local economy numbers).

Bad leaders come to Spokane to retire on the job. And no one cares. In fact, one Washington State labor economist concluded that Spokane attracts unemployed people 🙂

Mental Health

Youth suicide rate is 4 to 6 times greater than the State of Washington and Washington’s suicide rate is higher than the national rate.

SpoSuicides2005-2009Youth

How Bad is the Suicide Rate?

(There are counties, especially with high populations of native American populations living in poverty, such as in Alaska, where the suicide rates are much higher.)

Update July 5, 2018

Spokane depression rate higher than state, national averages according to a study by the Blue Cross Blue Shield Association.

For each successful suicide, there are 7 hospitalizations for attempted suicides, and 15 ER visits for suicide. There are even more cases of depression that result in 9-1-1 calls to the police (but which do not end up in an ER), and even more cases than that of people who never seek help. (Also see these youth suicide statistics). Multiplying that times the rates in the chart above yields a staggering number of severely depressed people in the area. Throw in the reports of bodies turning up in parks and rivers and you get the picture.

Nearby Kootenai County, Idaho has the 2nd highest rate of suicide in Idaho.

The Spokane Regional Health District says health is an indicator of the economy. This is an indicator of despair and hopelessness. And its off the radar as recommendations for reporters discourage reporting of suicides.

Related to the above, the annual days of sunshine in Spokane is on par with Seattle. But don’t tell that to the Spokane Visitors Bureau which believes Spokane has 260 days of clear skies per year!

Telling Outright Lies is the Local Pastime

A selection of prominent lies and the liars who tell them is listed here.

The basic culture of Spokane seems to be based on lies and deceit, causing the area to repeatedly earn a designation as the Scam and Fraud Capitol of America.

The Problem is Ignorance 

The long term trend in the Spokane area economy has been poor – its been treading water for 15 years.

In spite of much media PR puffery, people have a sense that things are bad. And the data confirm it is a bad situation.

Much of the local media act as cheerleaders, engage in “errors of omission” (a method of telling a lie which fits right into the local culture), and hide poor performance of elected and non-elected leaders. Failed leaders are not held accountable – instead, long term declining attendance at Spokane Public Facilities District is defended and actively covered up by the local newspaper. A decline in airport usage is called “continued growth” – and not one person in Spokane’s media even bats an eye at the egregious lie.  Visit Spokane claims it is nearly always clear and sunny in Spokane. A local promoter misquotes a tech industry publication to falsely claim Spokane is a high tech hot spot (when the publication actually said Spokane is NOT a high tech hot spot).

To this day, the Spokesman-Review is pained to present data in easy to understand charts, even when the State provides the charts for free. For example, here is the September 2014 employment chart and here is how they babbled on about this in words:

employment

The chart cannot be spun – Spokane has recovered about half of the jobs lost in the economic downturn while the State and the nation have recovered more than 100%. By hiding this from readers and viewers, Spokane’s local media censors the news through “lying by omission”.  Except for The Inlander, perhaps. (Note – former SR staffer Ryan Pitts left the SR to work on CensusReporter, a tool to make it easy for reporters to obtain Census data in easy to read charts. Tools exist. It’s not hard to illustrate stores with charts. But its hard to spin actual data.)

The outright lies and exaggerations are non-stop – hence, Spokane remains the scam and fraud capitol of America – but the zero credibility local media itself is complicit in re-telling and defending the lies (follow the links on this blog to see specific examples of the local media’s participation).

When land speculation is one of the top 3 industry clusters and the media is conflicted with land ownership and development,  reporting is warped.

The public has been intentionally kept in the dark as to the true state of Spokane – but many have seen these issues for a long time. Out of town visitors arrive and often the first thing they say is “Spokane looks like a run down dump” (check out the weeds growing out of the streets and sidewalks in August and you can see why).

This blog shed a light on the truth that has been hidden from the public – by showing the actual data, in simple to read charts, that directly contradict the local memes. Data is the enemy of propagandists in the local media.

The X Report

This site will remain on line as “The X Report“, just as “The Fancher Report” (summary here) lives on today, or how local corruption is documented in “Breaking Blue” or at Camus Magazine and other web sites.  It is no longer safe to publish skeptical inquiry on the Internet.

Before I moved to Spokane, an old friend who grew up here said, “X, Spokane is just a small town. Only bigger.”

Was not sure what he meant back then – but now I know: And he was right!

Nothing has changed in decades. Three decades of economic studies reached identical conclusions and were filed on dusty shelves never to be looked at again. Spokane remains behind the times, never reaching up to its potential as the 2nd largest city in Washington – but always hoping for an external savior (the current meme is the medical school brouhaha) to drop in and save the day. Before that it was regional health care. Before that Spokane was going to be an information technology center on par with Austin, Texas or may be even Silicon Valley. Before that it was going to be a manufacturing mecca. So we come up with an incoherent cluster strategy for economic growth.

But nothing has fundamentally changed. At this point, its down to more land speculation and more transfers to the oligarchs who will bleed the cash cow dry as long as they can keep it bleeding. And not one god damned local politician gives a hoot at the obvious decay and decline – they just continue to play along to earn bennies for themselves.

And because of that, this might be the very last post on this blog. The web site will stay online and be known as “The X Report”.

——

This blog is taking a break. No idea if it will return. Hard to imagine but 1/4th of all the posts made on this web site were never published! There are nearly 200 posts sitting in draft form 🙂 They were not published for many reasons including timeliness (the information was useful for a limited time), insufficient time to complete the post, insufficient data, or for a few I feared I would be run out of town if I let them fly. Ouch!

STA – “savings on fuel and maintenance would more than pay for the added cost up-front”

The $800,000 sticker price on the 41-foot model is high compared with the Gillig buses currently in the STA fleet. A conventional Gillig diesel bus costs $378,000 and a Gillig electric hybrid diesel is $550,000.

However, savings on fuel and maintenance would more than pay for the added cost up-front over the expected 12-year-life of the Proterra, said Dale Hill, company founder.

via STA officials view company’s latest electric bus model – Spokesman.com – Sept. 17, 2014.

Hmmmm…. that sounds familiar.  Here is what the STA said about the discredited electric hybrid diesels on March 24, 2009:

The acquisition of new buses, including the hybrids, will reduce ongoing maintenance costs for older buses as well as save on fuel costs.

In reality, “Spokane Transit Authority squandered taxpayer money on expensive buses” as the savings never came.

Typical of Spokane institutions, no one was held accountable for bad decisions, hence, it remains business as usual. And probably more squandered money, more puffy press releases and then a hidden reference years later to the program being abandoned.

STA buses to join 21st century

“Talking bus” route and stop announcements are being added to STA buses. Many other cities have had these “smart bus” systems for some time – audible announcements are required by the Americans with Disability Act: STA Begins “Smart Bus” Initiative – Spokane, North Idaho News & Weather KHQ.com.

King County began experimenting with smart bus and automated stop announcements in 2001. Pierce (County) Transit added these features in 2009.  Los Angeles began adding this in 2006. Spokane is just starting to build out its Smart Bus Initiative in 2014 as part of a ten year upgrade project. The Federal government allocated taxpayer funding for the Smart Bus Technology Modernization program in 2008. Funding for Spokane was buried in a bill by Senator Patty Murray in 2007. More information about the “intelligent” transportation system for the area is in this SRTC document.

As usual, Spokane is years behind but pretends its hip and cool when its merely catching up.  Businesses looking to be on the forward edge are not going to locate in a community that is perpetually years behind. It’s nice that STA is catching up but let’s not pretend we are the “bus of the future”.


Seattle Times: State does not need a WSU Spokane med school

Now, as Washington State University tries to gain statewide support to build a new medical school in Spokane, some regional and national experts say there’s no longer a pressing national need for another one.

State might not need a WSU medical school, some experts say | Local News | The Seattle Times.

A lot of this is about market control. The UW, which has failed to provide adequate med school slots in the state, does not want WSU as a competitor in Spokane and would prefer to go down the WWAMI route of having med school students rotate through various locations. The UW argues its brand reputation is stellar and will attract top students while a first year start up med school run by WSU would start, on day one, with the lowest reputation of all med schools nationally.

WSU-Spokane argues that a med school is needed in eastern Washington to ensure doctors in rural areas even though there is no evidence this solves the root problem: pay is lower in small towns, which does not work for young doctors paying off med school debts, and the lifestyle may not be what young doctors are seeking.

Only a few years ago local Spokane promoters convinced us that a Spokane med school was essentially a done deal and would be opening shortly. Now its pushed out another decade or more (UPDATE: Should be accepting students in about 2017-2018 assuming all goes to plan – this is good news. Meanwhile, the UW has partnered with Gonzaga University on future medical student training in Spokane. There is zero justification for Spokane to have two medical schools –  but one makes sense.)

Our past posts on the Spokane med school including the outrageous lies told about the alleged economic impact of a Spokane med school. In Spokane, people just cannot stop lying. I have never seen a community where lying is conducted so openly and passionately.

Spokane trolley cost estimates double

It was $36 million as recently as months ago: STA Votes To Approve Electric Trolley | News – KXLY.com.

Now its $72 million: STA considers $72 million trolley from Browne’s Addition to SCC

(Both KREM TV and the Spokesman-Review fail to mention the price doubling. Censoring the project history is bad journalism – or good fiction writing. )

Next year: $96 million? How about $129 million?

They are considering options that raise the price to $129 million for a system that is no better than a bus except its cooler. There is, in fact, no reason provided for this extraordinary expenditure except it has the cool factor.

As shown in many studies “there’s no clear evidence trolleys bring growth but it’s clear they’re expensive.”

What are the objective measures of success of this project?

There are none.

The only measure of success is they spend money, which is an easy target to reach! Indeed, with each passing month they keep increasing the price tag!  Spending Federal money is the only goal for this project.

Objective measures would set goals for:

  • Total passengers per day
  • Average passengers per trolley trip
  • Revenue earned per trip and per day
  • Operation costs per passenger per mile
  • Energy used per passenger per mile
  • Specific, measurable economic growth metrics

And management would be held accountable.  But lacking objective measures and that no one at STA management is ever held accountable, they’ll squander money once more. Remember their hybrid bus project that wasted money? All of the information needed to know that hybrids were a waste was available in advance. After the STA wasted the money, no one was held accountable.

The STA has not come up with a single meaningful reason for spending up to $129 million other than its “cool” and the Federal government would pay 80% of the costs. They will make absurd promises, just like the Convention Center expansion campaign lies about creating more jobs and visitors – when actual use of the PFD facilities has gone down during the past 15  years, jobs have gone down, and there is no evidence of an increase in visitors.

Meanwhile, the STA Plaza remodel is on hold after six years of planning – because the downtown business cartel did not approve. After six years of public involvement it now comes down to secret deal making between the business cartel and STA management. Update: It appears the downtown cartel will get its wish – at great taxpayer expense and rider inconvenience, the STA plaza will probably be moved out of downtown, throwing the STA system in to planning chaos (the STA plaza is THE central hub of the system). Second Update: A couple of sources say that original – linked – report that the STA Plaza might be moved was based on poor reporting and its not going to happen.

The evidence that downtown trolley’s create economic growth is nil but they are the rage for mid-sized cities all over the country since the Feds offered grant money. Mostly they shift local money to those who will benefit (downtown businesses) and away from other local businesses that are not so well connected.

  • Proponents must come up with compelling, fact-based arguments for the trolley. “Cool factor” and “spending Federal money” do not cut it.
  • Proponents must develop a set of objective measures of project success.
  • Spokane’s news media must perform actual journalism in spite of their conflicts of interest (instead we are already seeing the puffy propaganda)
  • Local political leaders must ensure that the STA management is held accountable to specific, measurable objectives.

If these steps are not taken, this is just another feel good project designed to funnel other people’s tax money into the downtown business cartel, leaving most of Spokane worse off, in the long run.

Spokane and CDA area dogs seek “Suicide by cop”

After the recent police shooting of an innocent dog in Couer d’Alene, the script started out according to plan.

First, they impugned the reputation of the deceased. They labeled him a “vicious pit bull” that was  armed with paws and teeth and was apparently seeking to commit “suicide by cop”. The word “vicious” is an obvious code word for “mentally ill” and “excited delirium”, a  medical condition that exists solely when dogs or people interact with the police.

Of course, the victim was actually a 2 year old black lab. Oops. And the bullet hole went through the glass of the window pane (read the comments there, including from a witness, and see the window pane photo here), meaning the “vicious pit bull” black lab was on the other side of the window.

After killing the dog, they broke into the vehicle, stole the dog’s body and left this business card on the blood spattered vehicle: “Please contact city police watch commander regarding your dog”. Soon more contradictions in the official statements were noted. And there’s more – why abandon a vehicle without finding the owner, when moments earlier, the van was falsely alleged to be involved with looking at children – so the PD then abandons the van?

The PD had to cancel the press release naming the officer and telling us about his experience, awards, training, and the sainthood elevating gold stars.

It is obvious: dogs nationwide are seeking “Suicide by cop” amid mounting incidents of police killing innocent dogs.

You likely heard about a police officer entering a secured Salt Lake city backyard recently, searching for a child that had been found 30 minutes before, and then shot and killed the dog that lived in the yard. This is happening all over the United States.

Yep, another dog obviously seeking suicide by cop.

Seriously. (And if you cannot figure it out, much of the above is satire. Biting satire in this case, of course.)

Back in the real world, a lot of us have encounters with dogs, but for some reason, us regular folk don’t need to shoot every dog that barks, raises hackles, bares teeth or just looks damn scary.

  • I have lost count of the number of times I was chased by dogs while riding a bike. If it gets rough, a quick shot of water from my water bottle into the dogs face stops the dog in its tracks. Works every time.
  • I’ve had a dog leap out the back end of a station wagon and charge me  – I did not shoot the dog.
  • I had a dog come up along side me, while on my bike, and rip my pants. I did not shoot the dog.
  • On many occasions, I have had dogs try to attack my dog or dogs, while walking my leashed dogs. I did not shoot any of the dogs.
  • I have had dogs chase me while jogging. I did not shoot the dogs.
  • Postal workers, utility workers, delivery truck drivers – lots of people interact with dogs every single day. And none of them shoot the dogs.

It’s only when a police officer is involved that we see this “suicide by cop” phenomena among dogs. Some how the rest of us routinely deal with upset dogs without killing them.

If any of us were spooked by a dog in a van, pulled out a gun and shot through a window pane to kill the dog, we would be arrested and in jail.

But not the police. That’s because all these dead dogs were seeking “suicide by cop”. This is obvious. I am surprised the CDA police have not explained this – its standard procedure after most officer-involved-shootings now – impugn the reputation of the victim and claim the victim was seeking “suicide by cop” or suffered from “excited delirium”. The latter pretty much explains every dog I have met – most are in a state of excited delirium, especially the young ones.

The CDA police officer will suffer zero repercussions.  The police department will investigate itself and conclude the officer’s actions were fully justified. They know they are immune from the rules that apply to everyone else and they will continue to shoot dogs because they can and there is nothing any of us can do about it. Throughout the country.

(Update Aug 2014) Weeks after the shooting, the CDA Keystone Cops have still not released the name of the officer who shot the dog through the van of the window.  Compare this lack of transparency with recent shootings of people in Spokane: in Spokane, the police routinely release information specifically intended to impugn the reputation of the victim while elevating the officers to sainthood.  This double standard is inexcusable and unacceptable and the leadership and leadership staff of the CDA Keystone Cops should be fired for their double standard and obvious coverups. (For reference see: Police Shooting Propaganda Manual, Spokane Propaganda-Style)

If the officer says they felt threatened then it is a justified killing and that is that.

From the comments here, the  CDA police have a record of shooting innocent dogs.  Their unprofessional handling of this situation puts them somewhere between the Keystone Cops and Idaho’s reputation for red neck behavior and pulling over cars with Colorado license plates because weed is legal in Colorado. (Am pretty sure they also need to abide by the 4th amendment and get a warrant to remove a body from within private property, once the “emergency” is over.)

Welcome to the militarized police state where all of us and our pets are “the enemy” of the state.

Spokane Convention Center charges a fee to watch the 4th of July Fireworks

Riverfront Park fireworks display organizers charge to watch from PFD steps.

This is new

Organizers charged people who wanted to sit on the stairs behind the convention center.   It cost $5 to $10 for a seat on the stairs. It cost $20 for seats on the dock.

and

All of the money from the tickets goes to the convention center.

The most likely reason for the new fee is to inflate the attendance count at the underused Convention Center. You can be sure that those who paid the new fee will be counted as Convention Center attendees. In spite of 3 expansions, the facilities continue to have fewer attendees than they did 15 years ago.

WSU-Spokane’s Diversity Problem

In light of yesterday’s comments that the Spokane WWAMI program is losing students, it seemed appropriate to re-look at WSU Spokane enrollment.  Enrollment spiked in 2004-2005, but is now less than it was ten years ago in spite of massive expenditures on improvements and the introduction of new programs. It is unclear how this trend leads to a $1.6 gazillion $ economic impact on Eastern Washington.

chart_1(1)WSU Spokane enrolls women almost exclusively


Data is from the WSU Office of Institutional Research for Fall of 2013.

Undergraduate students account for 46% of the total 1,376 students enrolled (includes both full time and part time students). In other words, roughly half the students are undergraduates and among this group 87% are female and 13% are male.

chart_4

When including the graduate students at WSU-Spokane, the diversity of the student population expands slightly to include more male students.chart_3If the percentages were reversed – 13% female and 87% male, local politicians, activists and the media would accuse WSU of discrimination. Instead, we have silence.

Bottom line: WSU-Spokane is failing to meet the educational needs of male students in Spokane.

This is a ticking time bomb – someone will eventually file a complaint or lawsuit against the publicly funded WSU for discriminating against male students in the Spokane region.

WSU, UW in pissing match over future Spokane medical school

UW and WSU continue to argue over Spokane-based medical education or a med school.

Spokane promoters again point to an exaggerated and fictitious economic impact, and the parent of a Spokane WWAMI medical student rips the Spokane operation, saying facilities are inadequate and students are abandoning the program.

Spokane leaders point with pride to the city’s growing importance as a provider of medical services, and cite a 2010 consultant’s report which says that a new medical school there would have a $2.1 billion statewide economic impact — $1.6 billion of that in Eastern Washington.

via WSU, UW spar over future of region’s med schools | Local News | The Seattle Times.

See “Forecast Economic Impacts of the Spokane Medical School” to learn why this claim is a work of fiction. Spokane is famous for its tall tales and lies. Also see “WSU-Spokane’s Diversity Problem” (enrollment is 73% female, 27% mail overall, and 87% female at the undergraduate level).

The parent of a WWAMI student at the Spokane campus (see comments of “user492056”) provides this feet on the ground perspective that the facilities are inadequate and most of the students are abandoning the program – something that Spokane’s propaganda shill media are not reporting on:

The current Spokane medical sciences education site is a cooperative venture between Eastern, Gonzaga, Whitworth, and WSU for the education of nurses, physical therapists, occupational therapists, dental students, and pharmacists.  The afterthought space left over for medical students is completely inadequate.  The lecture space accommodates at most twenty students without even providing electrical outlets to let students use modern technology.

Only nine of the past year’s twenty first year Spokane medical students are choosing to stay in Spokane for their second year.  This fact speaks volumes.  None of Pullman’s first year medical students are going to Spokane for their second year despite aggressive recruitment.  All of them are transferring to Seattle to complete their medical education.

If true[1], Spokane’s multi-zillion $ economic impact medical education program seems to have failed at launch. In real cities, these allegations would be the subject of the 4th estate keeping local government in line. But, you know the story, this is Spokane and we have Spokane promotional media.

[1] Since Confirmed as true. Buried in the Journal of Business on page 27 a few days after this post went live. Thank you JoB and SR (also) for eventually covering this story.

Keywords: Spokane medical school Hoopfest lilac festival parade

Spokane Propaganda Style Manual Revealed

The link is about New York City’s propaganda style manual, explaining how they inflated their tech sector to pretend the city is competitive with Silicon Valley (when it is not). They must have read the Spokane style guide! See NYC Desperate to Pretend It’s a Huge Tech Hub — Daily Intelligencer.

1. Define tech really, really broadly [to include sales jobs, video editors, photocopy machine repair techs]

2. Fudge the scale on your charts.

Make up anything!:

3. Optimize the formula for your city’s benefit [split other areas, like the SF Bay area, into 2 chunks, and then compare yourself to either half!]

The Spokane Public Facilities District chose this approach by publishing economic impact studies only for the not normal 2007 and  modified calendar 2010 years and pretending this would be the normal economic impact every year for Spokane:

4. Ignore the measurements that really matter.

Lots more Spokane examples here!

Basic message: Spokane retains its title as the fraud and scam capital of America. We work hard at this and are damned proud of it – so there!

Corollary: To fix this muddy flat lined economy, the local culture must embrace the truth and stop the lying, distortion and exaggeration. Unfortunately, that will never happen.

Keywords: Bloomsday, run, lilac, festival, parade, marching, bands, spokane, convention, center